Lancet Inf Dis Article: Here. Mobile Version: Here. Visualization: JHU CSSE. Automation Support: Esri Living Atlas team and JHU APL.
Data sources: WHO, CDC, ECDC, NHC and DXY. Read more in this blog. Contact US.
Downloadable database: GitHub: Here. Feature layer: Here.
Visit the Johns Hopkins Coronavirus Resource Center where our experts help to advance understanding of the virus, inform the public, and brief policymakers in order to guide a response, improve care, and save lives.
Point level: City level – US, Canada and Australia; Province level – China; Country level – other countries. All points shown on the map are based on geographic centroids, and are not representative of a specific address, building or any location at a spatial scale finer than a city.
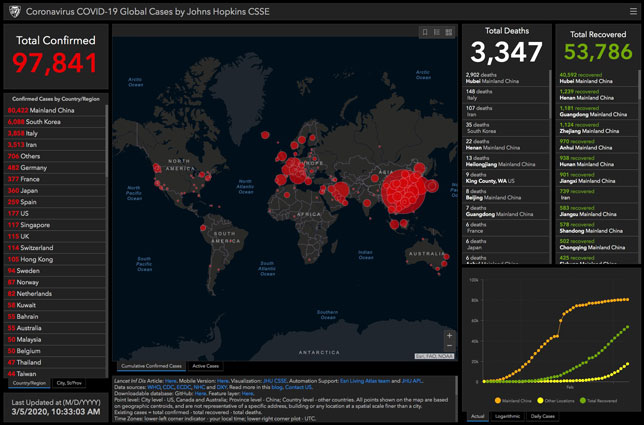
Active cases = total confirmed – total recovered – total deaths.
Time Zones: lower-left corner indicator – your local time; lower-right corner plot – UTC.
Note: All cases of COVID-19 in repatriated US citizens from the Diamond Princess are grouped together, and their location is currently designated at the ship’s port location off the coast of Japan. These individuals have been assigned to various quarantine locations (in military bases and hospitals) around the US. This grouping is consistent with the CDC.
This website and its contents herein, including all data, mapping, and analysis (“Website”), copyright 2020 Johns Hopkins University, all rights reserved, is provided to the public strictly for educational and academic research purposes. The Website relies upon publicly available data from multiple sources, that do not always agree. The Johns Hopkins University hereby disclaims any and all representations and warranties with respect to the Website, including accuracy, fitness for use, and merchantability. Reliance on the Website for medical guidance or use of the Website in commerce is strictly prohibited.
namely severe acute respiratory syndrome coronavirus 2 (SARS-CoV-2). The outbreak has since spread to every province of mainland China as well as 27 other countries and regions, with more than 70 000 confirmed cases as of Feb 17, 2020.
In response to this ongoing public health emergency, we developed an online interactive dashboard, hosted by the Center for Systems Science and Engineering (CSSE) at Johns Hopkins University, Baltimore, MD, USA, to visualise and track reported cases of coronavirus disease 2019 (COVID-19) in real time. The dashboard, first shared publicly on Jan 22, illustrates the location and number of confirmed COVID-19 cases, deaths, and recoveries for all affected countries. It was developed to provide researchers, public health authorities, and the general public with a user-friendly tool to track the outbreak as it unfolds. All data collected and displayed are made freely available, initially through Google Sheets and now through a , along with the feature layers of the dashboard, which are now included in the Esri Living Atlas.
and WHO situation reports
for within and outside of mainland China, respectively (figure). Furthermore, the dashboard is particularly effective at capturing the timing of the first reported case of COVID-19 in new countries or regions (appendix). With the exception of Australia, Hong Kong, and Italy, the CSSE at Johns Hopkins University has reported newly infected countries ahead of WHO, with Hong Kong and Italy reported within hours of the corresponding WHO situation report.
