 strangesounds.substack.com
You have any clues?
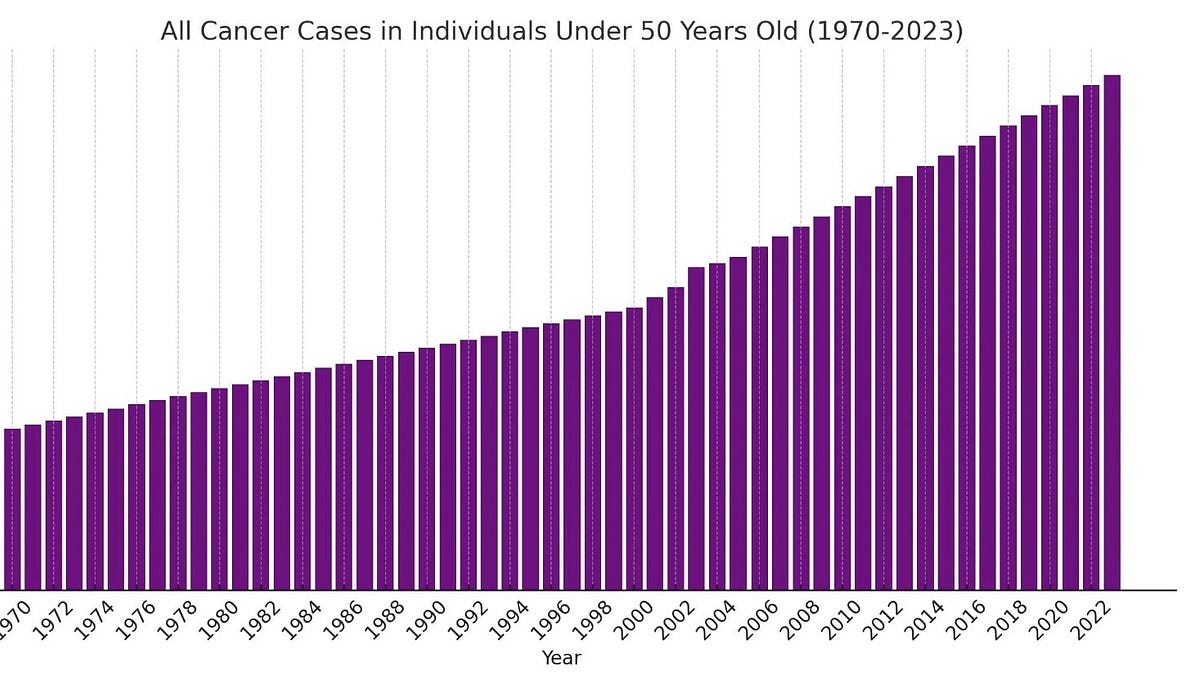
The below charts compile cancer data for U.S. adults under 50yr from:
- The Surveillance, Epidemiology, and End Results (SEER) Program by the National Cancer Institute (NCI)
- The World Health Organization (WHO) International Agency for Research on Cancer (IARC)
What happened around year 2000 to cause cancer jumps like this?


A rational explanation…
2002 saw the ratification of a bill that required non-cancerous brain tumors to be included as well as cancerous ones to a central repository/database. Meanwhile, in 2000, the CDC came out with a central repository/database for cancer statistics, likely in response to the upcoming bill ahead of time. It stands to reason that companies involved in the burgeoning big data management used this massive headache of an upcoming problem to their advantage and devised a solution as a selling point in their software which would have included regular cancer statistics- other companies likely caught on. Obviously this is speculation on HOW it happened, but it does stand to reason that a bill passing could cause a shift like that…
READ FULL ARTICLE HERE… (strangesounds.substack.com)

Home | Caravan to Midnight (zutalk.com)


