 Strange Sounds
 What’s going to happen when the water runs out? That’s when the water wars start!
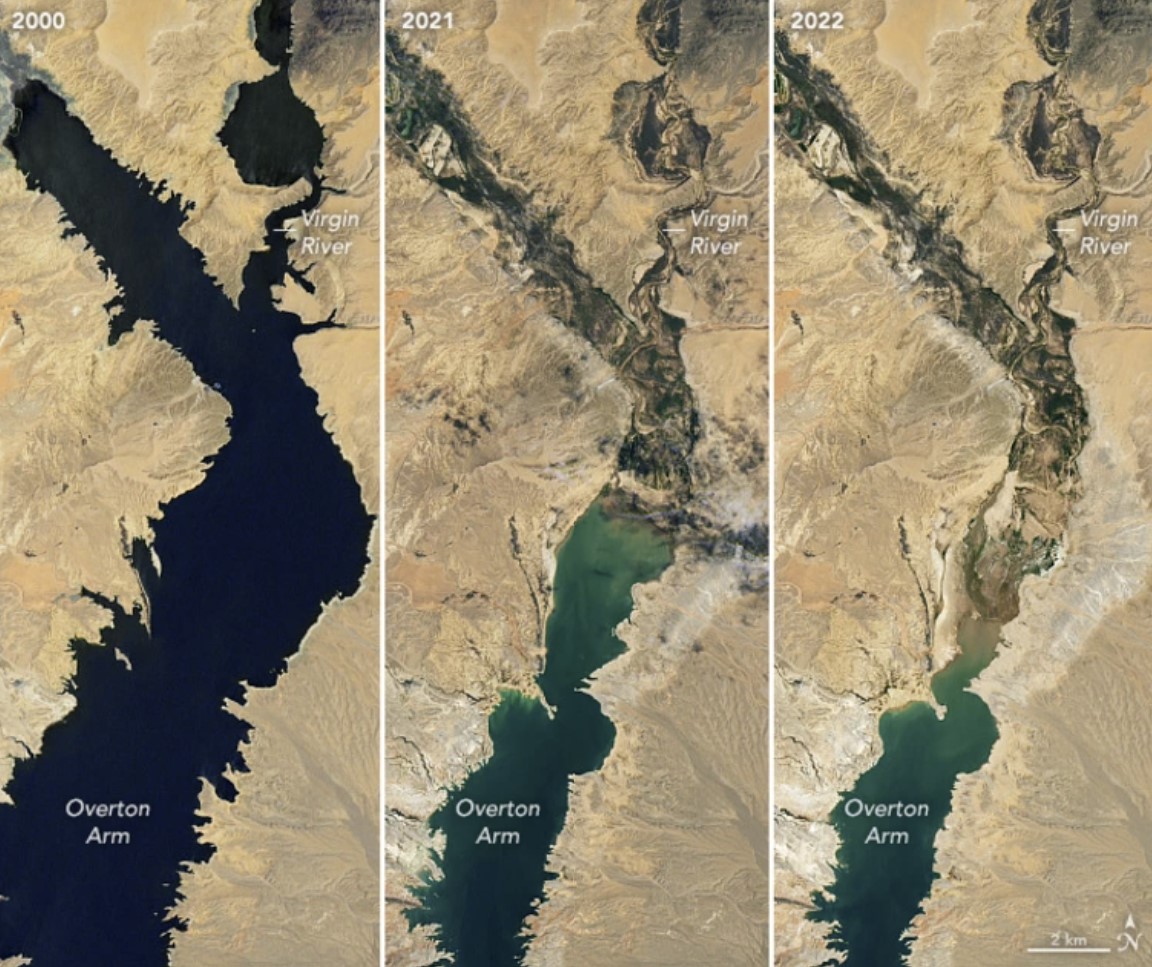
Another way to understand understand where we are with Lake Mead is looking at those graphs of water level and, more importantly, storage over the years…
The observant reader will notice a pattern of rapidly varying water height in the Lake Mead chart above from 1935 until the mid-1960s, after which the water level became more consistent in the short term. My theory is this smoothing was caused by the fact that Lake Powell, upstream from Lake Mead, began to fill in 1966, taking 17 years to fill completely (that would take us to 1983)…


